Exclusive Data — Only Available Here
4,500+
Active barges tracked
815
Terminals & refineries tracked
129
Major ports covered
22
Major regions covered
14,000+
Track of monthly bunkered vessels
9M+ tons
Monthly bunker volume tracked by Spotbarge


Ask questions in natural language and get instant answers with visualizations
Natural Language
Ask questions in plain English - no complex queries or filters needed
Interactive Charts
Automatically generates bar charts, pie charts, and other visualizations from your data
Data Tables
View detailed terminal visits, vessel movements, and cargo data in structured tables
Smart Insights
Get contextual analysis and patterns - the AI explains what the data means
See how Spotbarge AI transforms complex maritime data queries into clear, actionable insights with charts and tables.
"Create a dashboard out of this data"
Instantly generate interactive HTML dashboards from your data. Watch the code stream in real-time, preview your dashboard, and copy or download the HTML with one click. Switch seamlessly between code view and live preview.
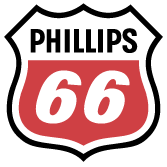
"How many bunkering operations did MSC have in December 2025?"
In December 2025, there were a total of 922 bunkering operations for MSC vessels across all monitored regions. The busiest regions were ARA (259 operations), Singapore/Malaysia (223), and the MED (168).
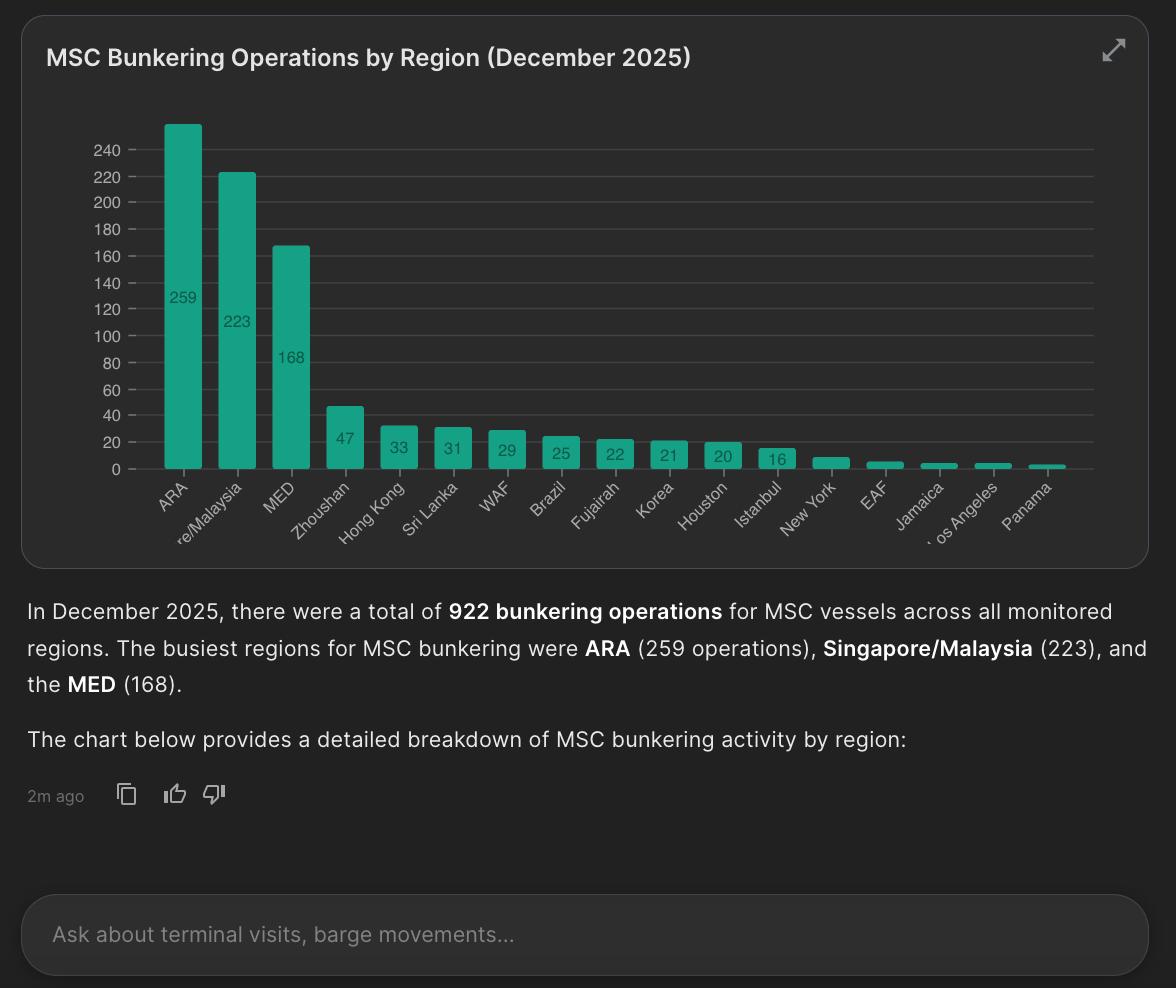
"How did the bunker volume and fuel type HS and LS in the MED change comparing November and December?"
In the MED region, the total bunker volume increased by approximately 10.5% in December compared to November. HS Operations decreased by 15.4% while LS Operations remained relatively stable at -3.4%.
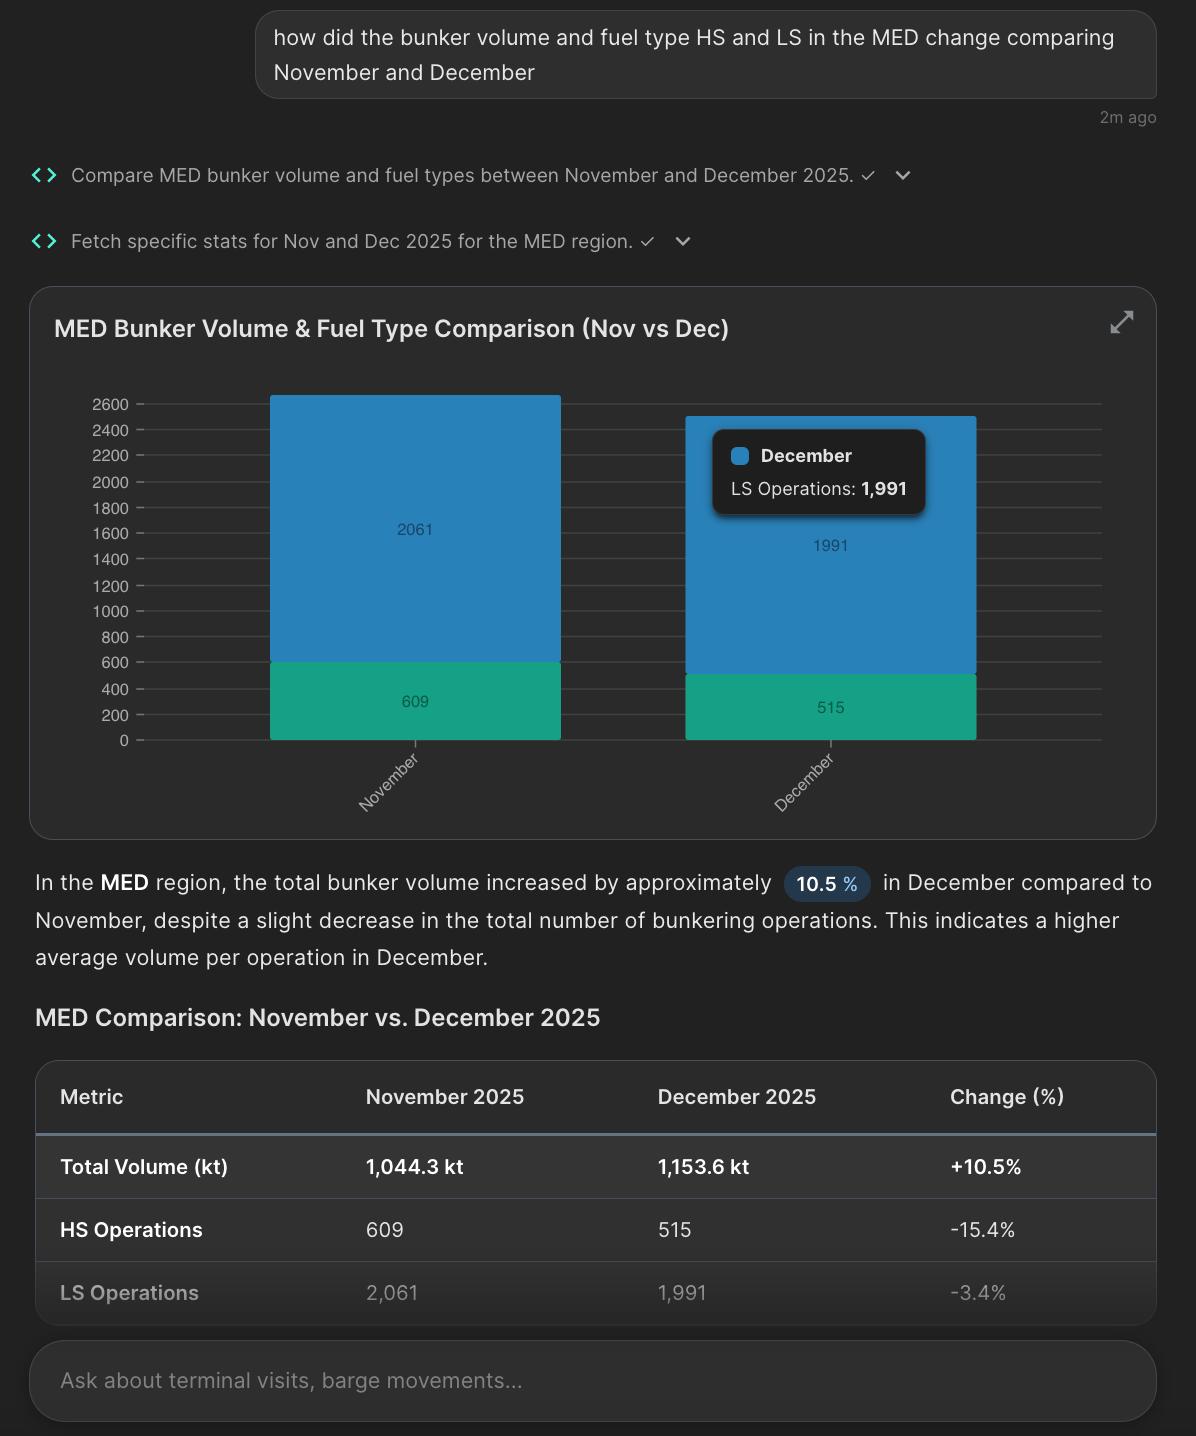
"How was the barge utilisation of bunker barge Vlissingen in December?"
In December 2025, the bunker barge Vlissingen (9,264 DWT) maintained a high utilization rate, serving as a dedicated delivery vessel for Maersk in Rotterdam with 9 loading cycles and 17 bunkering deliveries.
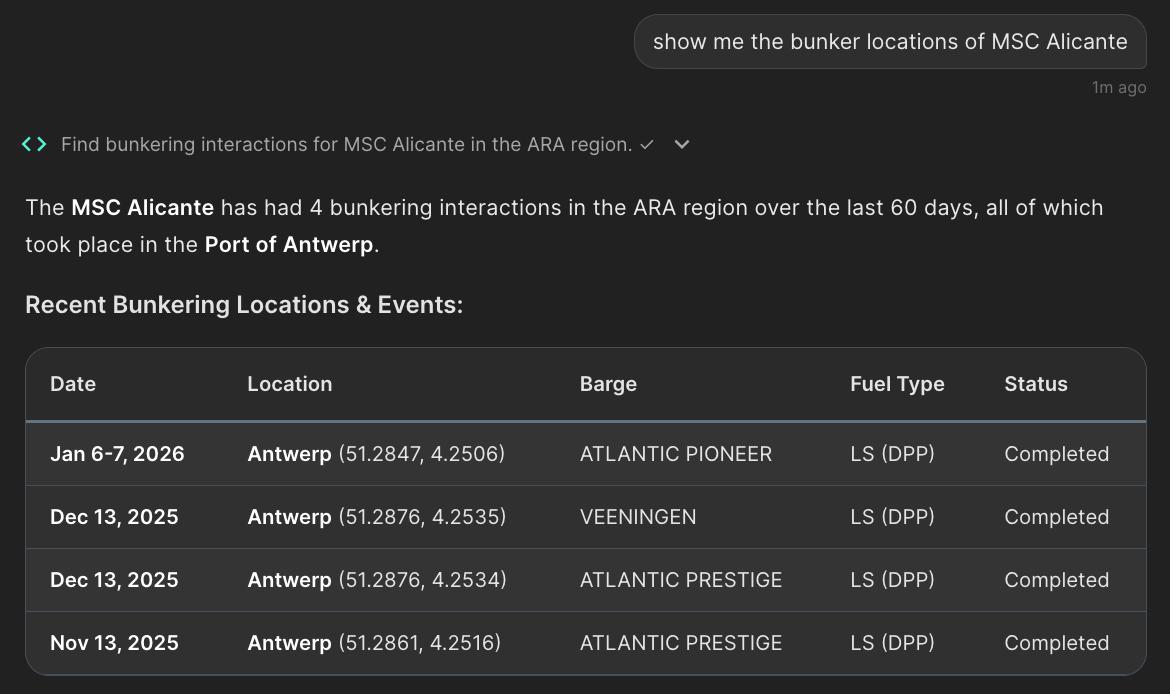
"Show me the bunker locations of MSC Alicante"
The MSC Alicante has had 4 bunkering interactions in the ARA region over the last 60 days, all taking place in the Port of Antwerp.
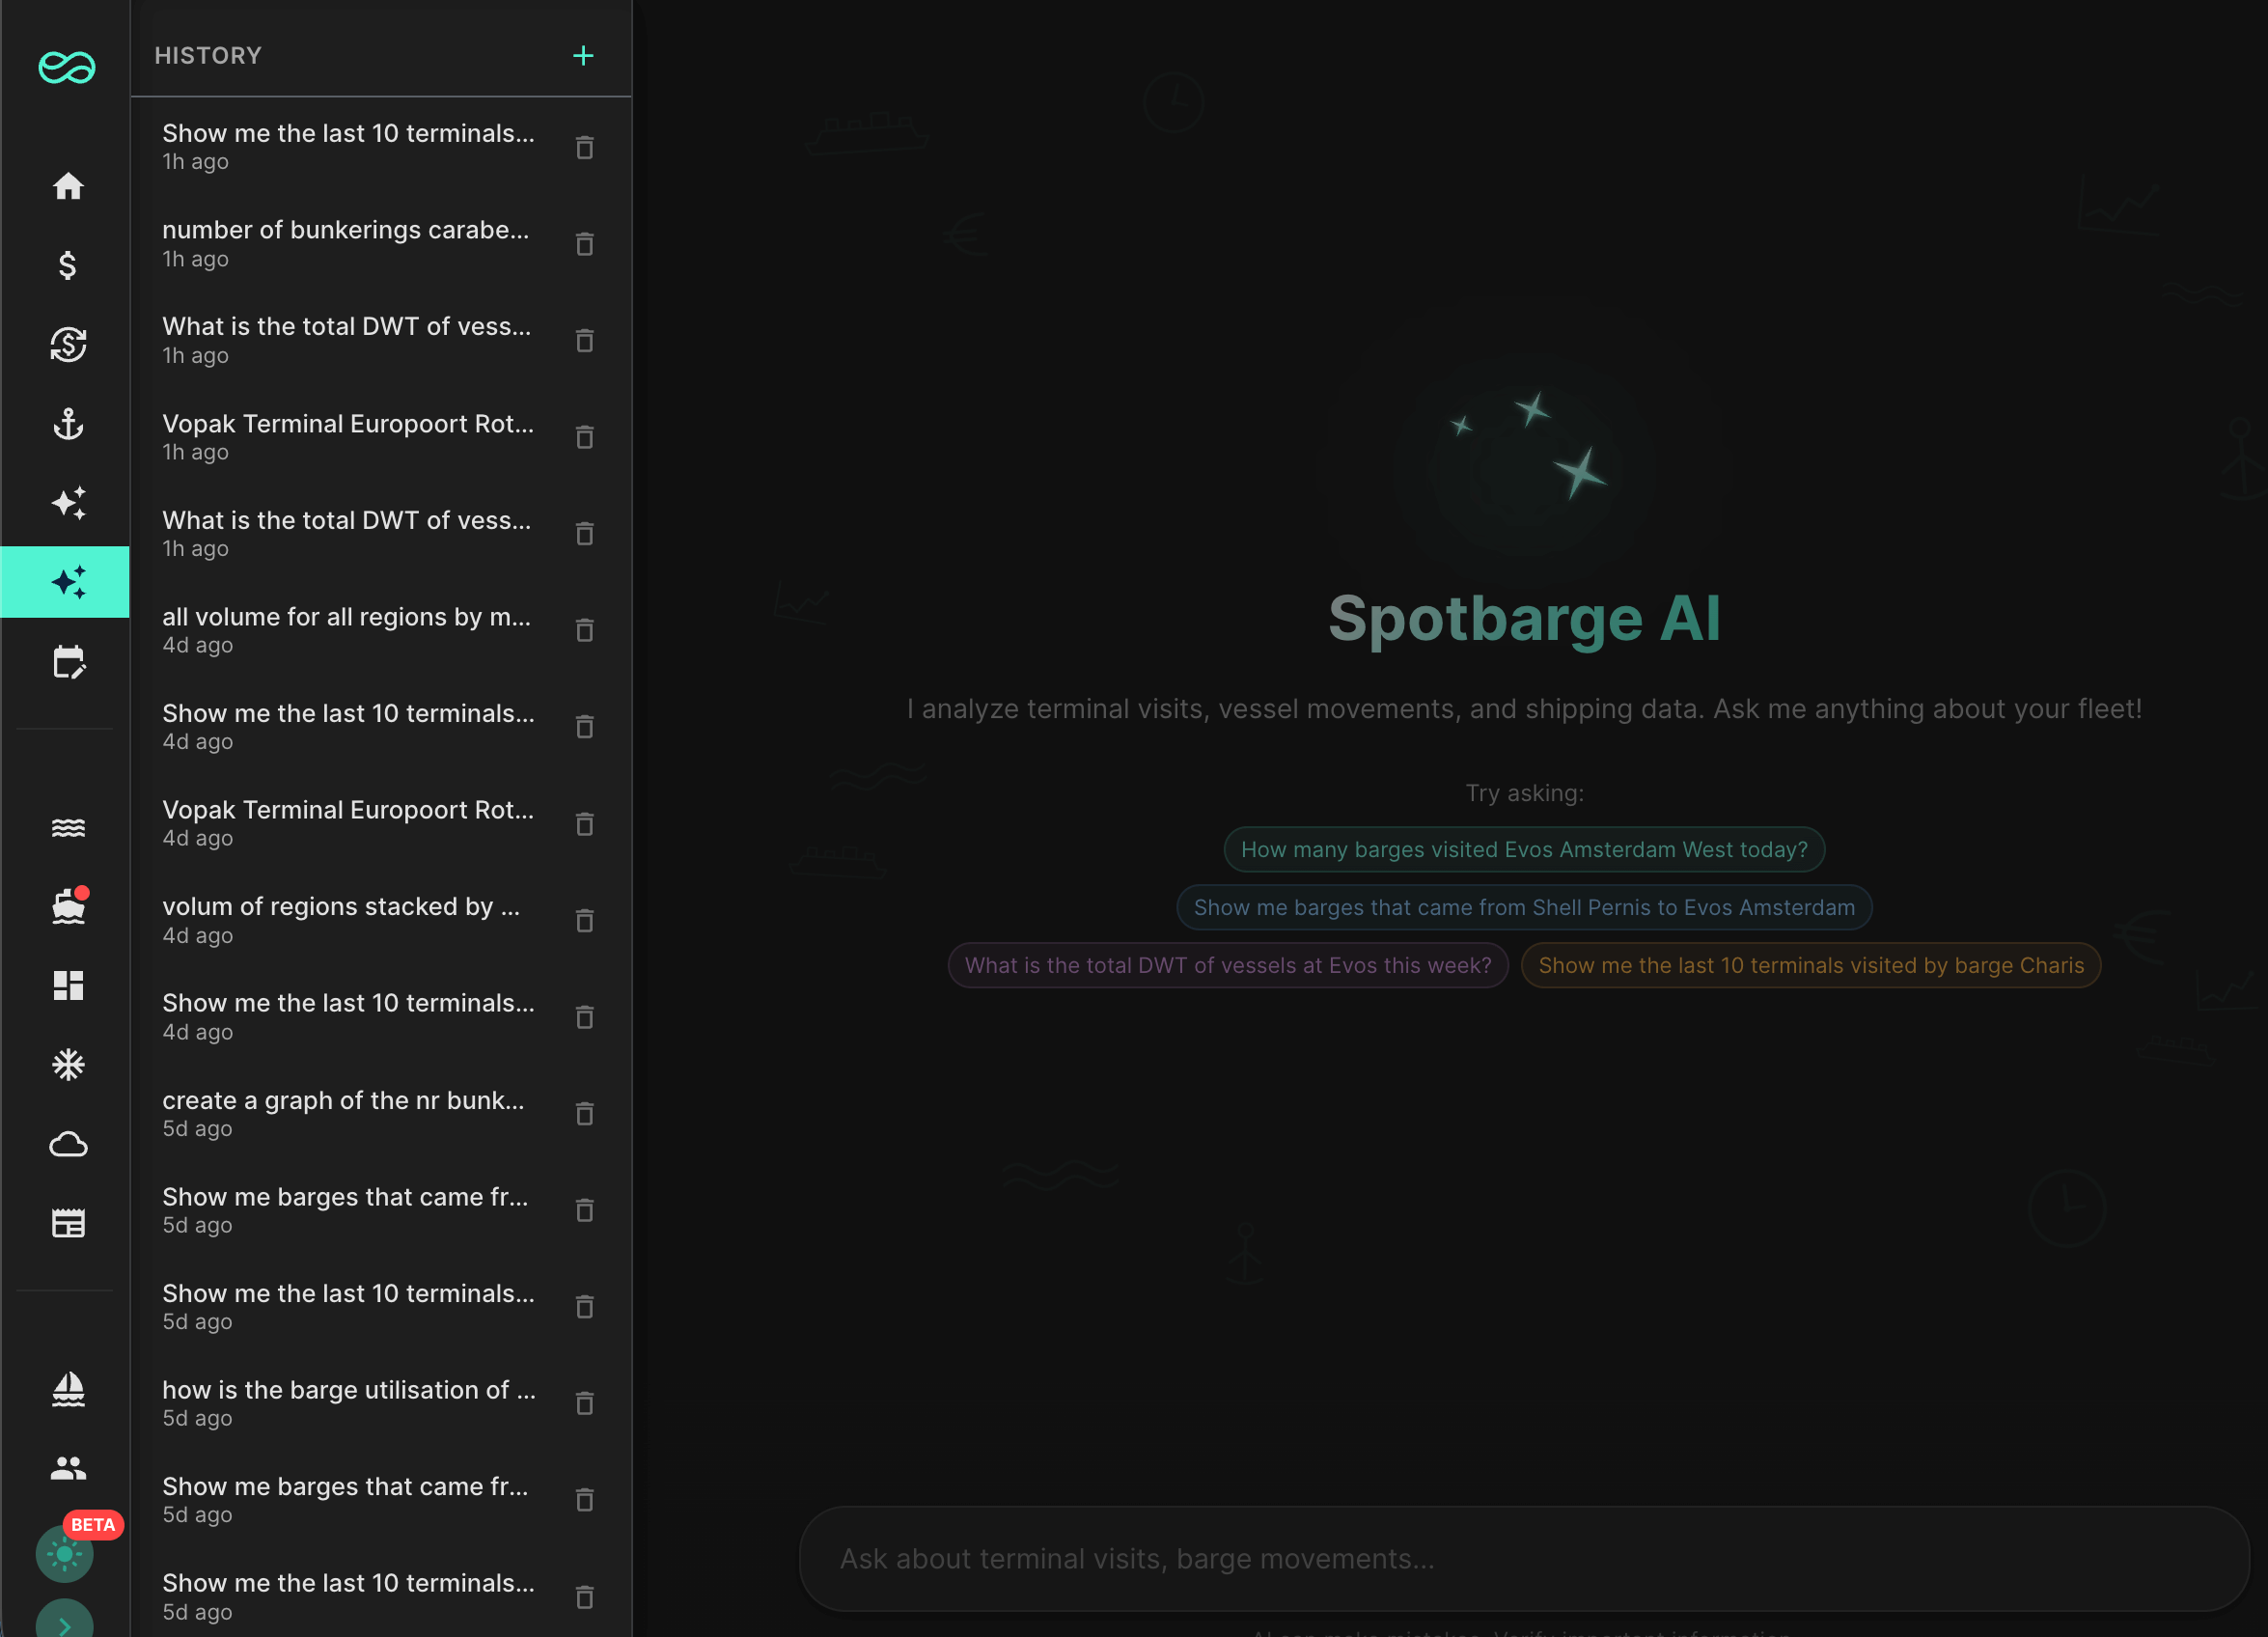
Chat History
All your AI conversations are automatically saved and organized. Easily revisit previous queries, pick up where you left off, or reference past insights. Your entire analysis history at your fingertips.
Automatic conversation saving
Quick access to previous queries
Continue conversations anytime
Search through past insights
Rich Responses
Complex data deserves elegant presentation. Our AI renders responses as interactive, beautifully formatted tables when appropriate. Sort, filter, and explore your data with ease.
Auto-formatted data tables
Sortable columns
Easy data export
Clean, readable layouts
Visualizations
Transform your data into stunning visualizations. Our AI automatically selects the best chart type for your query, or you can request specific visualizations.
Spotbarge AI has access to all data available on your account
Terminal visits and movements
Vessel tracking and history
Cargo and product information
Regional data (ARA, UAE, Singapore, and more)
Bunker operations and fuel data
Freight rates and market trends
Features
Users
Company
Resources
SpotBarge
© 2026 by Spotbarge B.V. All rights reserved.