logo

Port & Refinery utilization

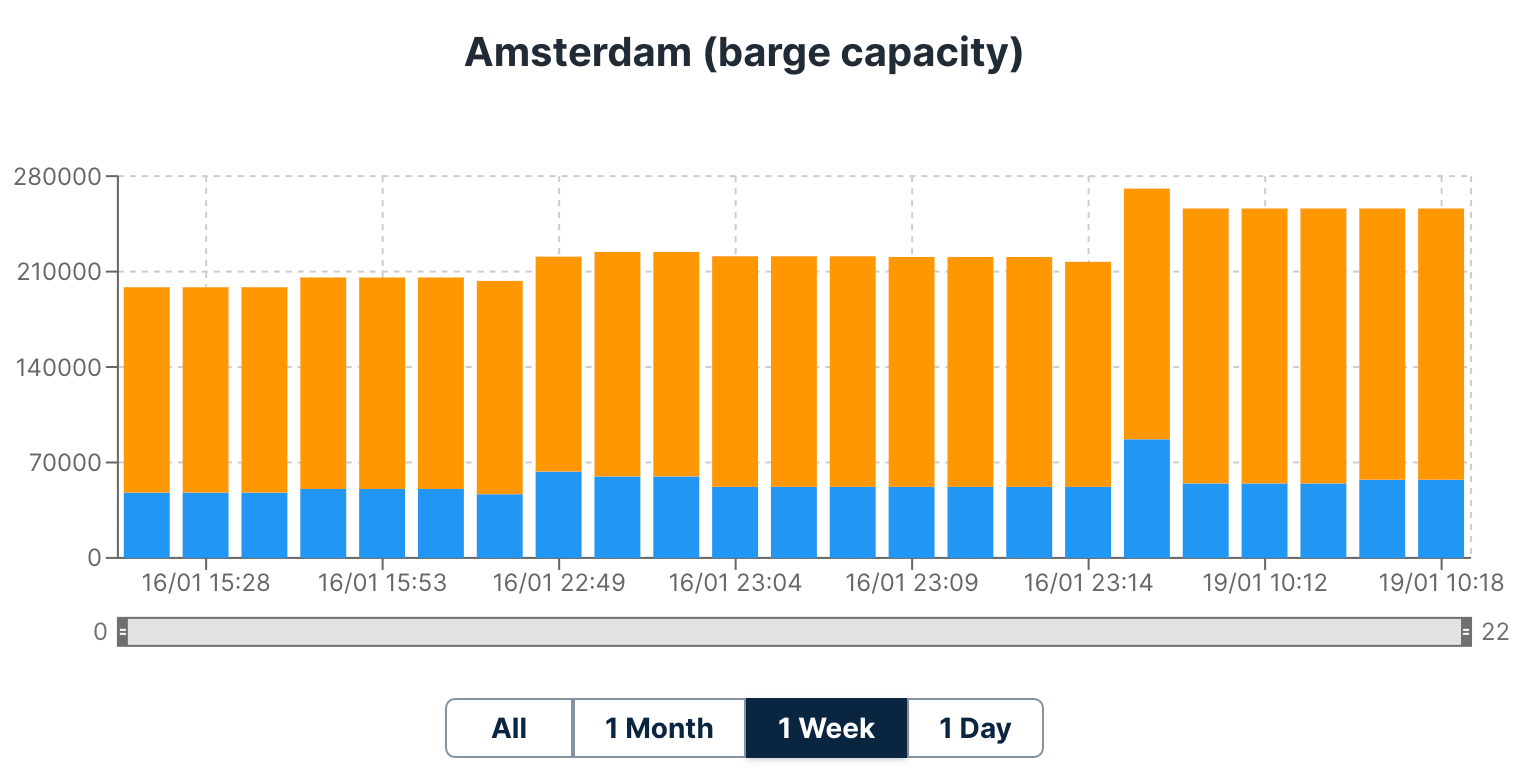
Our Spotbarge platform includes intuitive graphs that analyze port activity in critical regions. These tools offer real-time insights into port and refinery utilization, allowing you to make informed decisions and optimize your operations.

Request demo
Port utilization

Port utilization

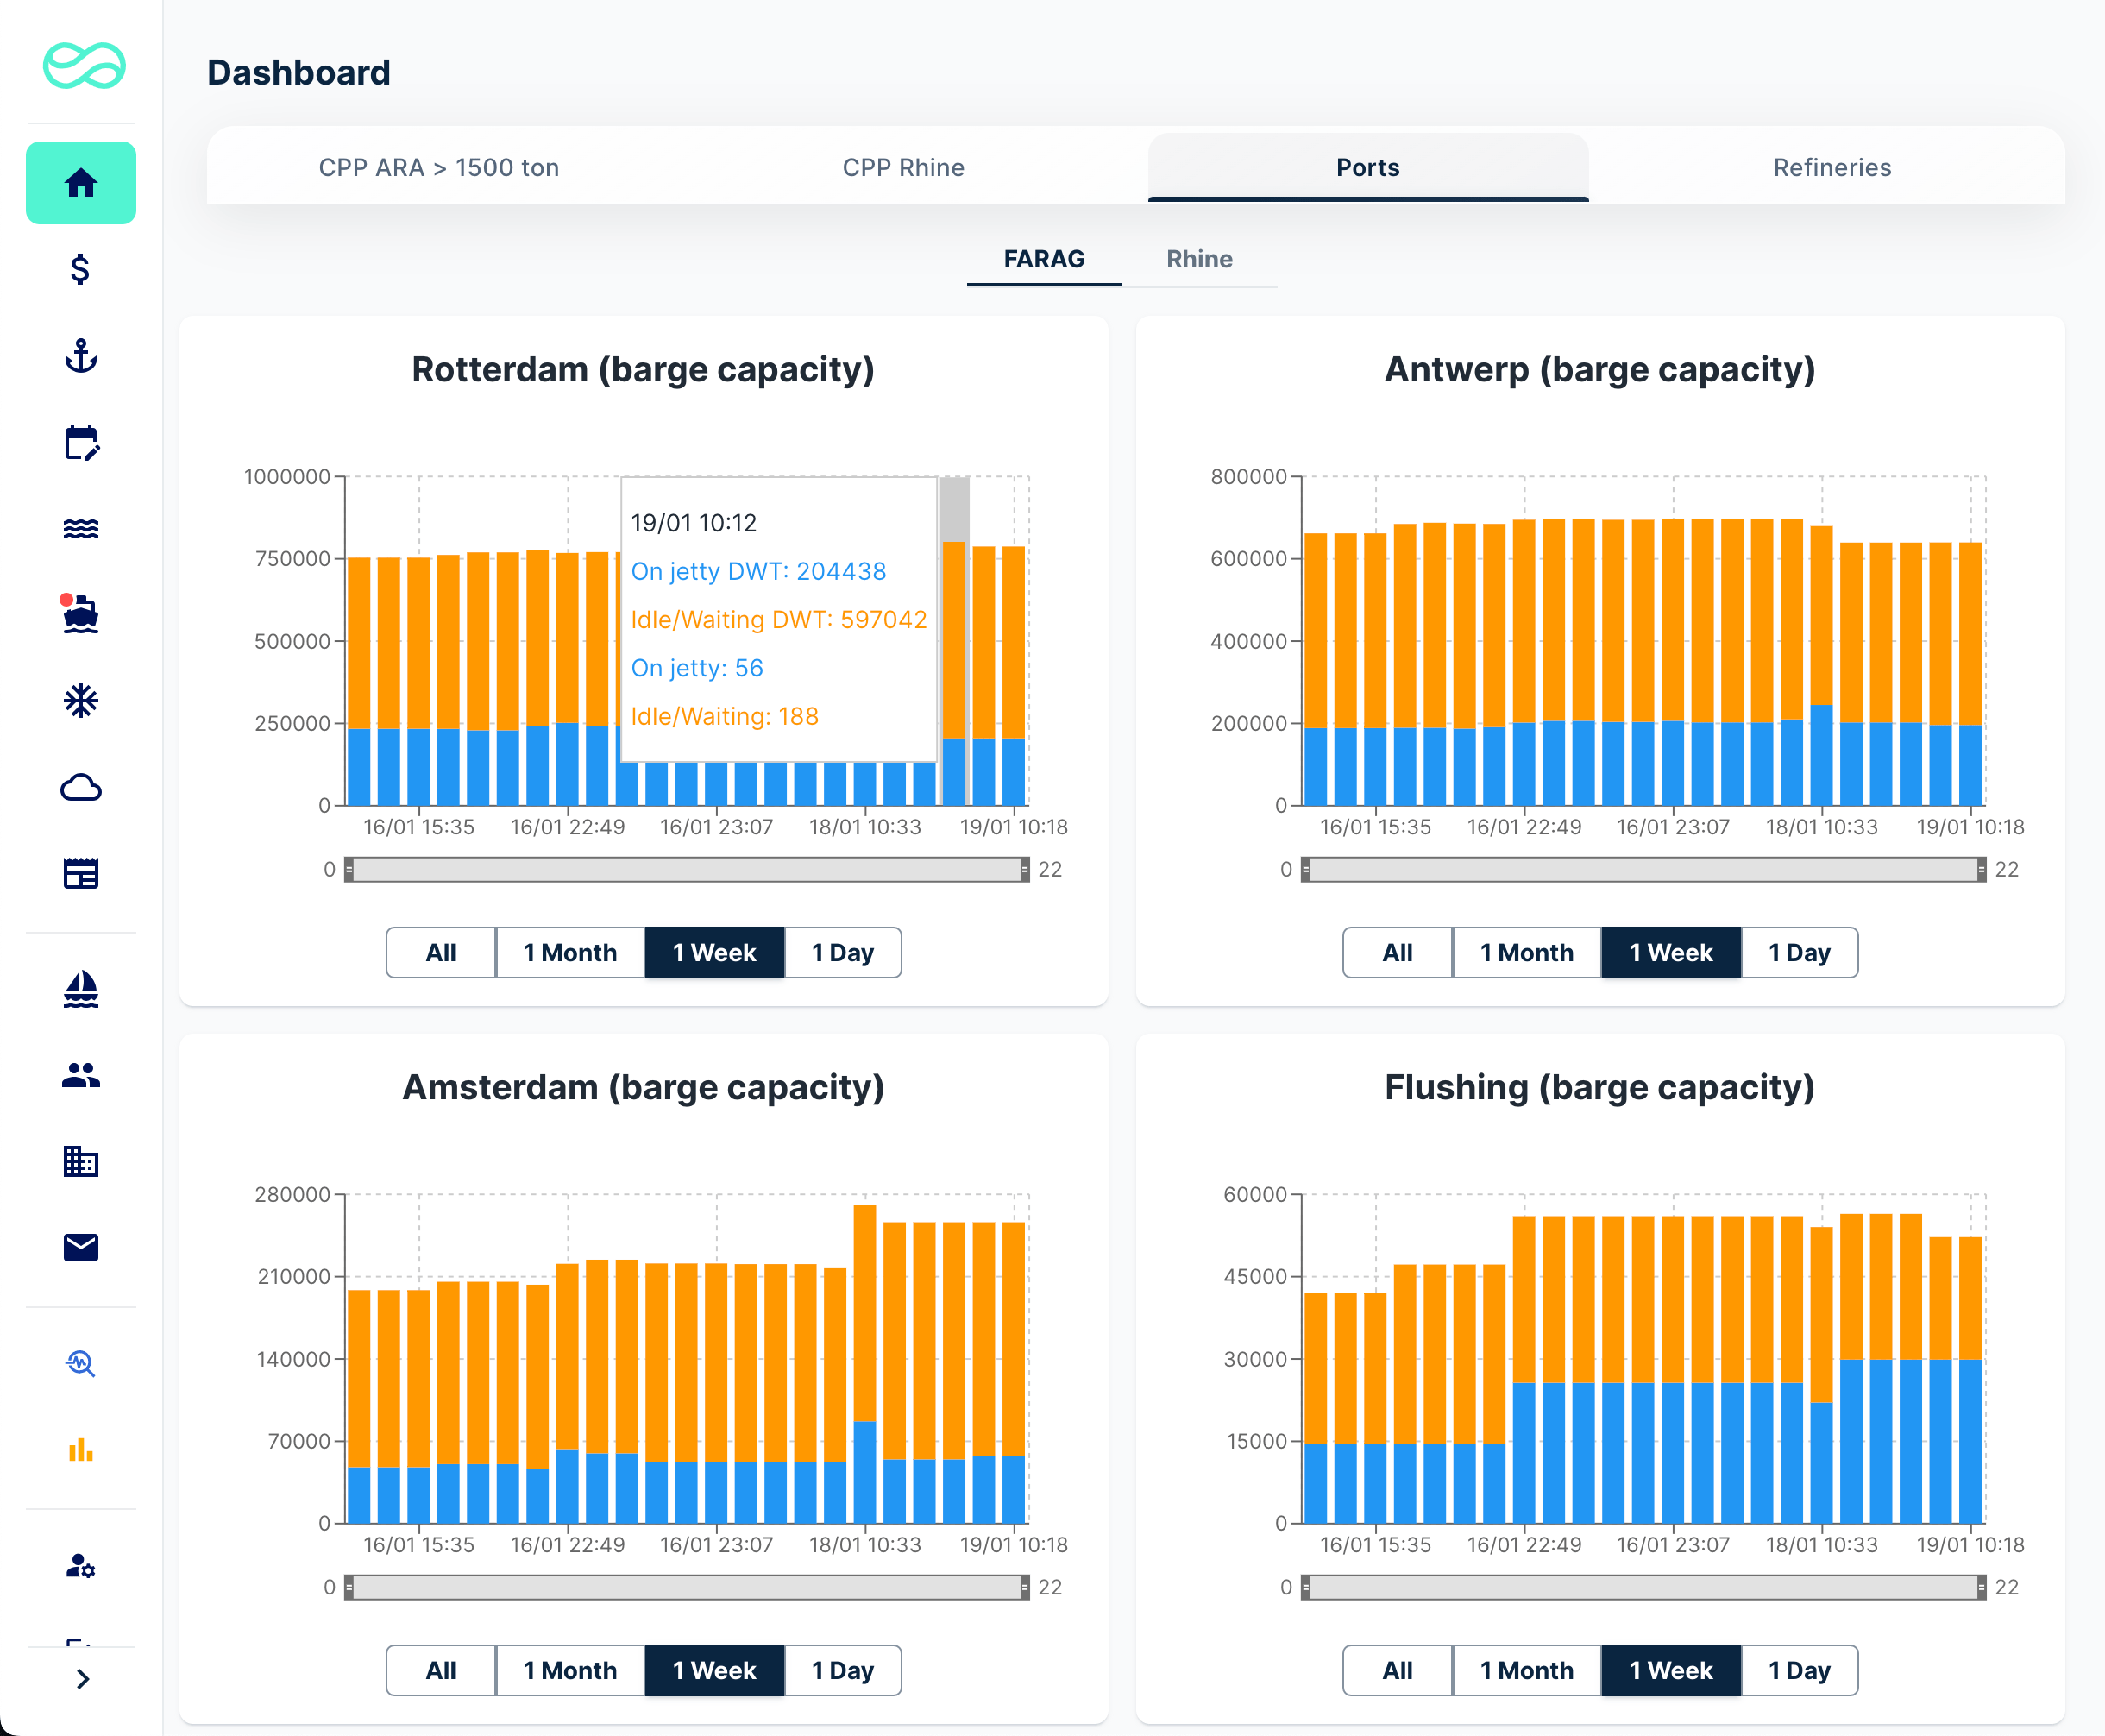
Track real-time port utilization with our comprehensive monitoring system that provides detailed insights into vessel movements and berth occupancy.

FARAG Region:
  • Ports analyzed: Flushing, Antwerp, Rotterdam, Amsterdam, and Ghent.
  • This region represents a vital gateway for European trade, known for its high cargo throughput and dynamic trading environment.
Germany:
  • Ports analyzed: Duisburg, Cologne, Ludwigshafen-Mannheim, Karlsruhe, and Basel.
  • These inland ports connect vital trade arteries across Europe, playing a crucial role in regional and international supply chains.
What the graphs show:
  • Barge counts: Monitor the total number of barges currently in port.
  • Jetty utilization: Track the number of barges actively docked at jetties.
  • Port activity trends: Understand real-time port congestion and evaluate how busy each port is.
Benefits of this feature

Benefits of this feature

Market visibility & trend analysis

  • Dynamic market monitoring: Analyze barge activity to identify trade hubs experiencing higher demand or increased market focus.
  • Demand forecasting: Leverage port activity data to anticipate surges in demand driven by seasonal trends, trade shifts, or water level changes.
  • Competitor insights: Understand which ports are attracting the most activity, potentially signaling where competitors or customers are focusing their efforts.
Refinery utilization

Refinery utilization

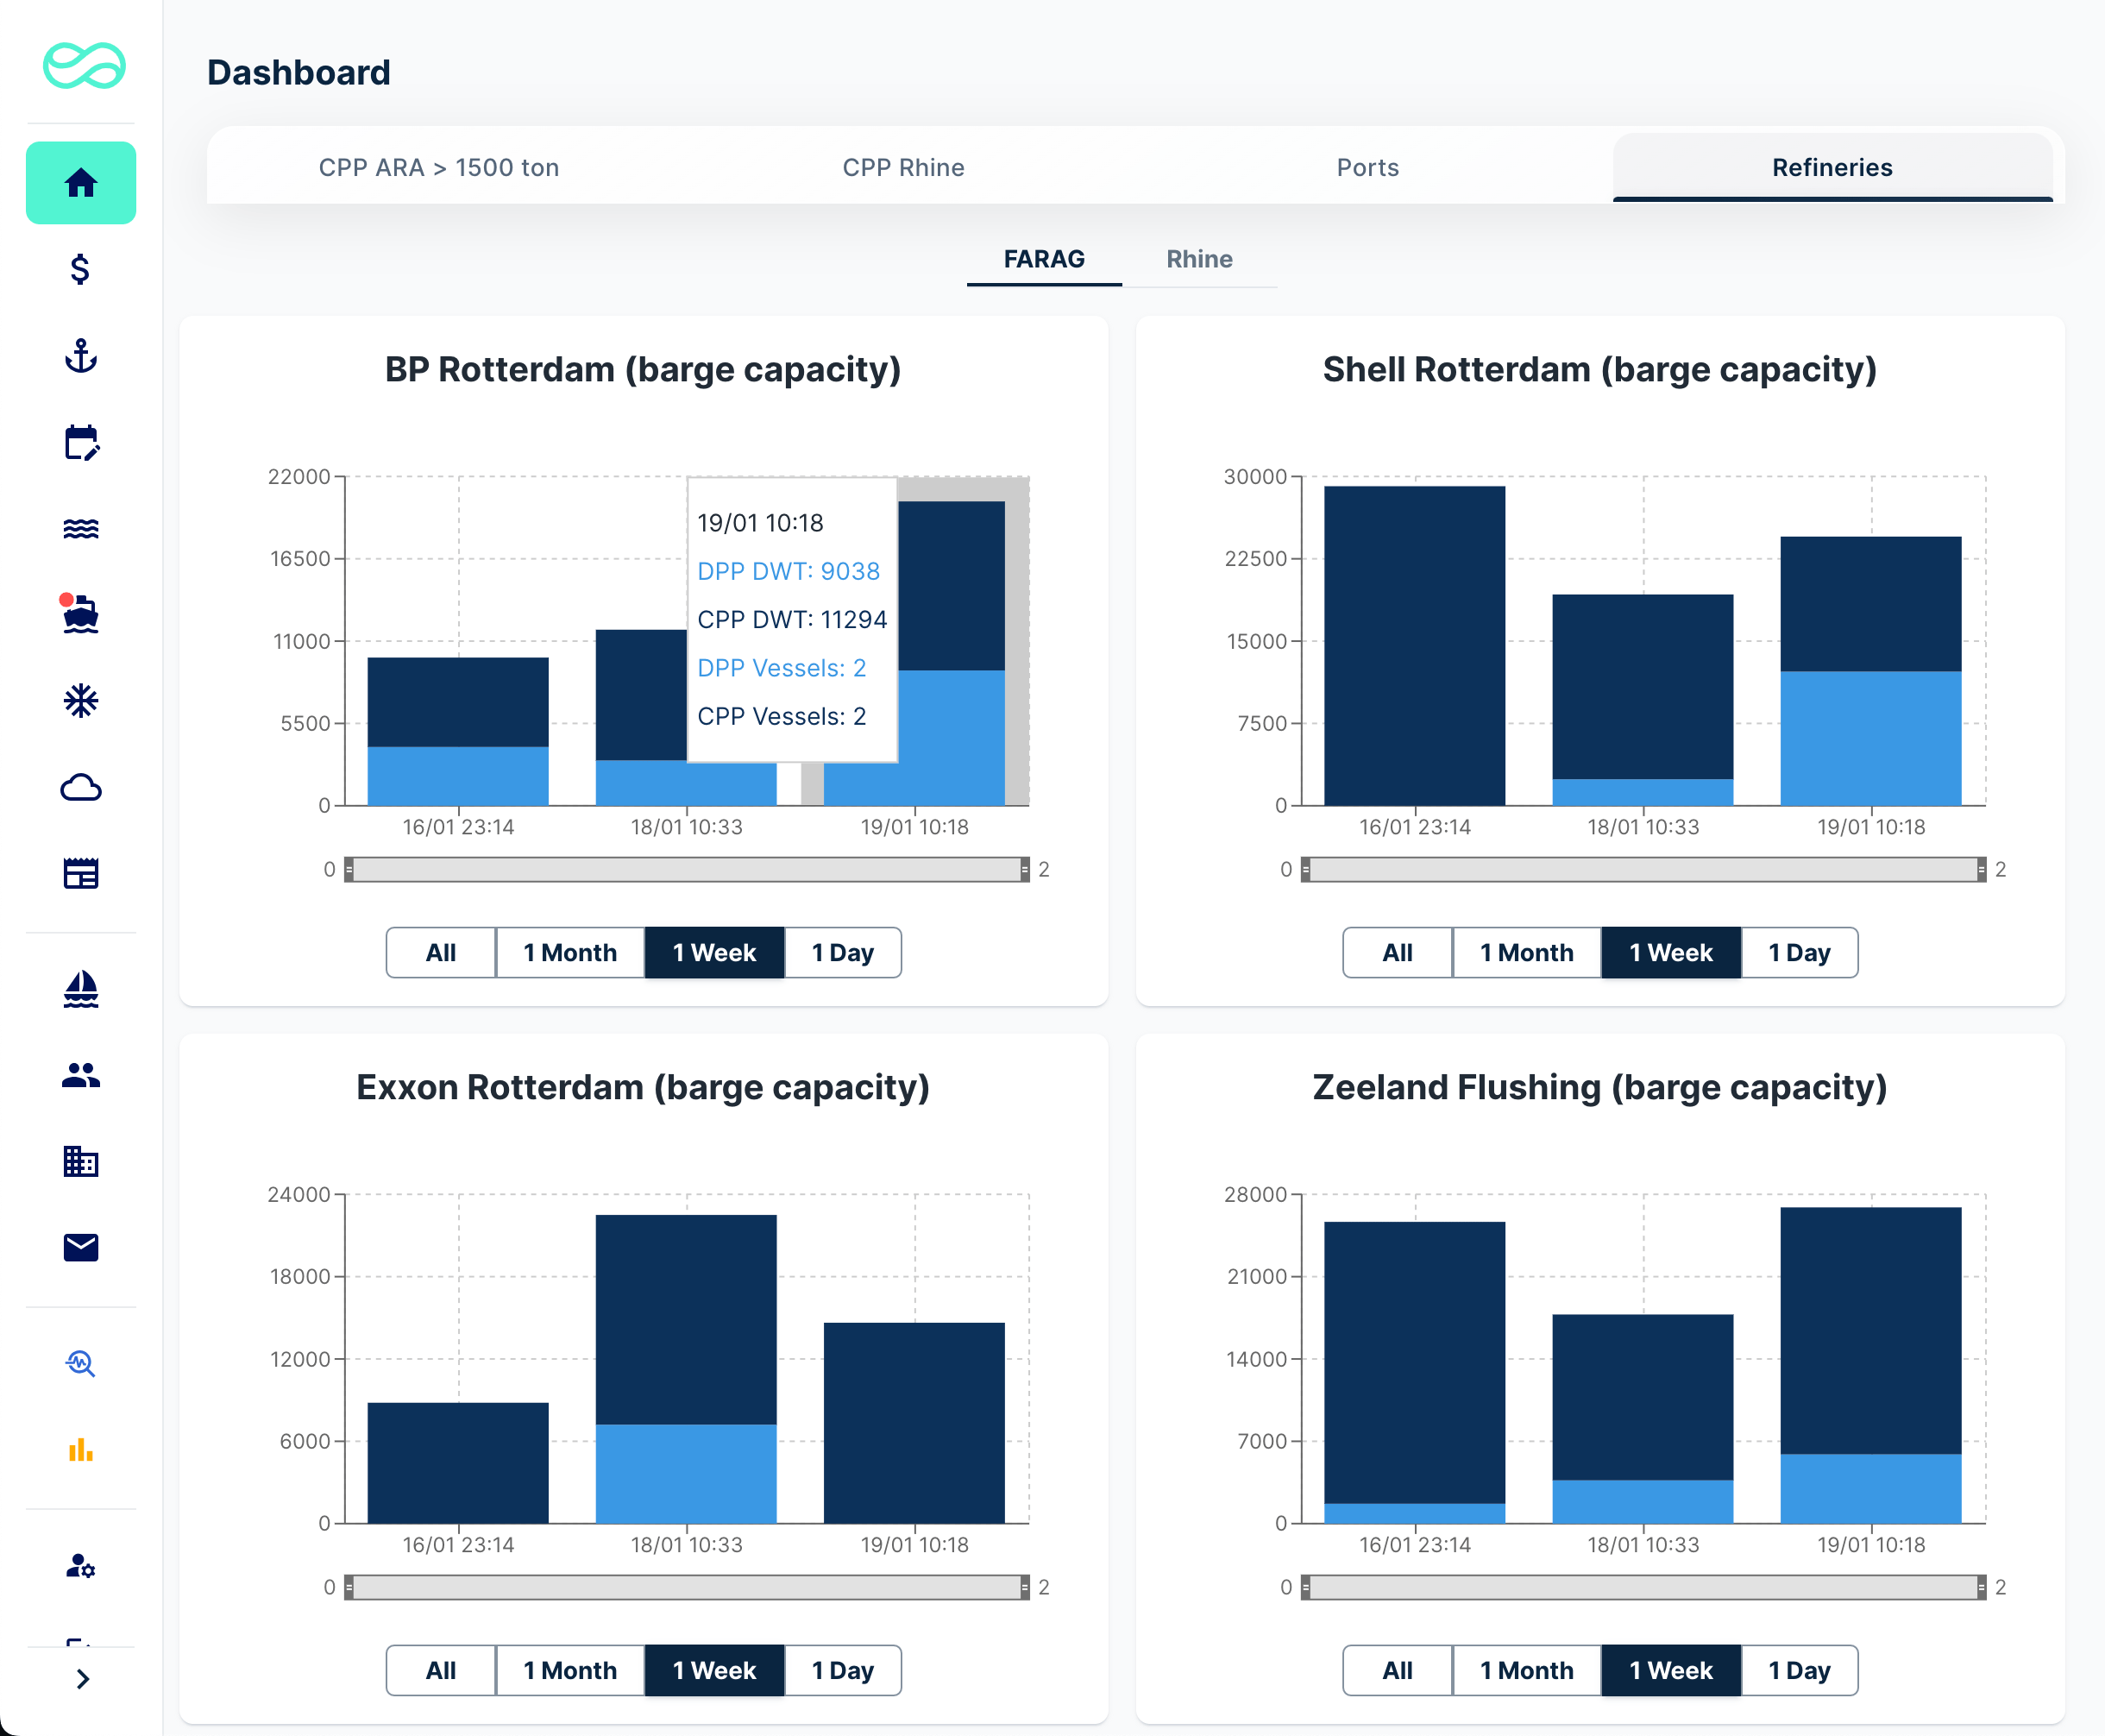
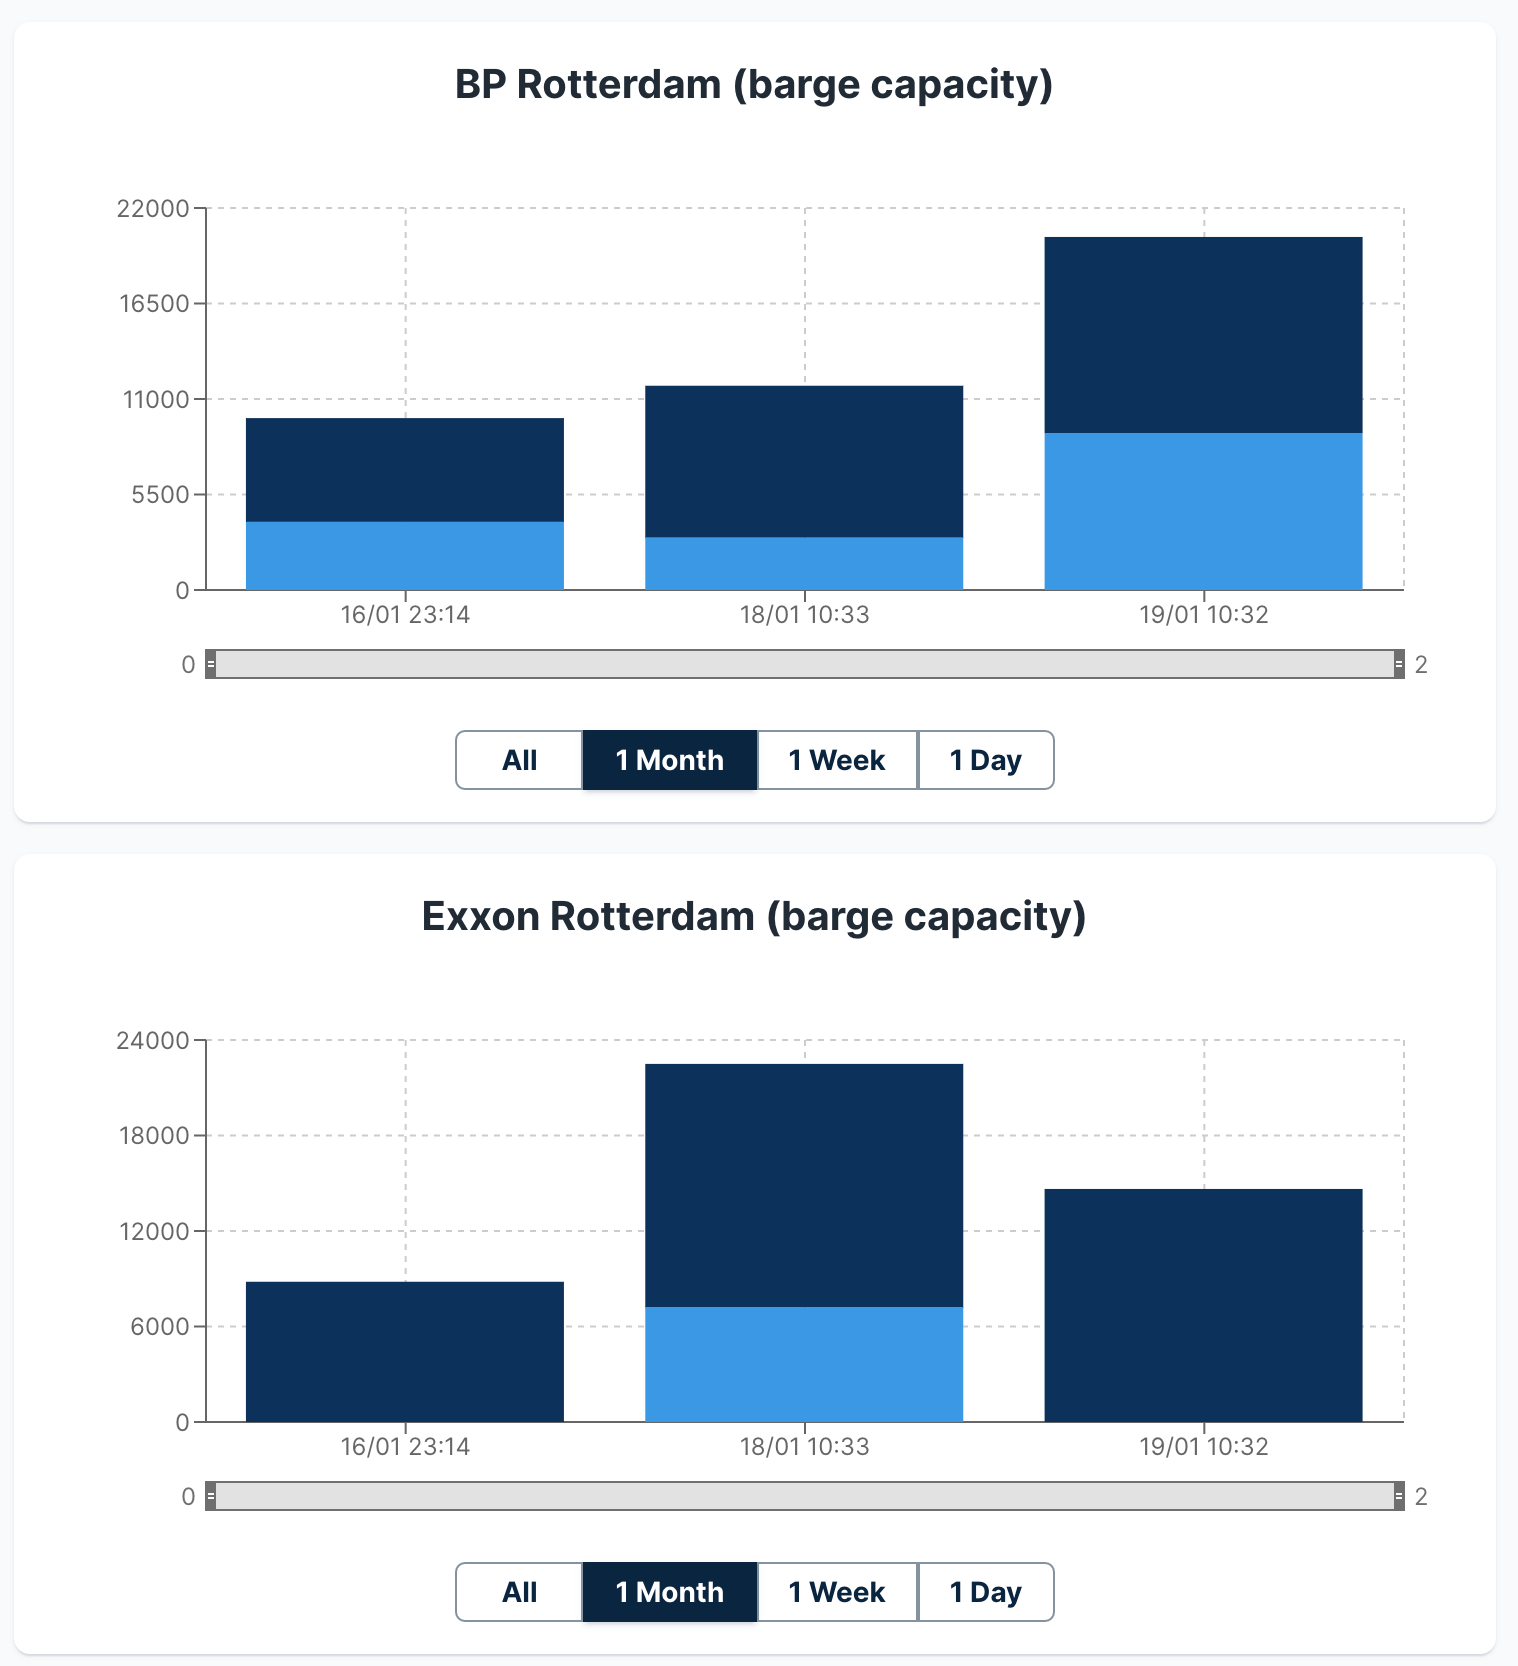
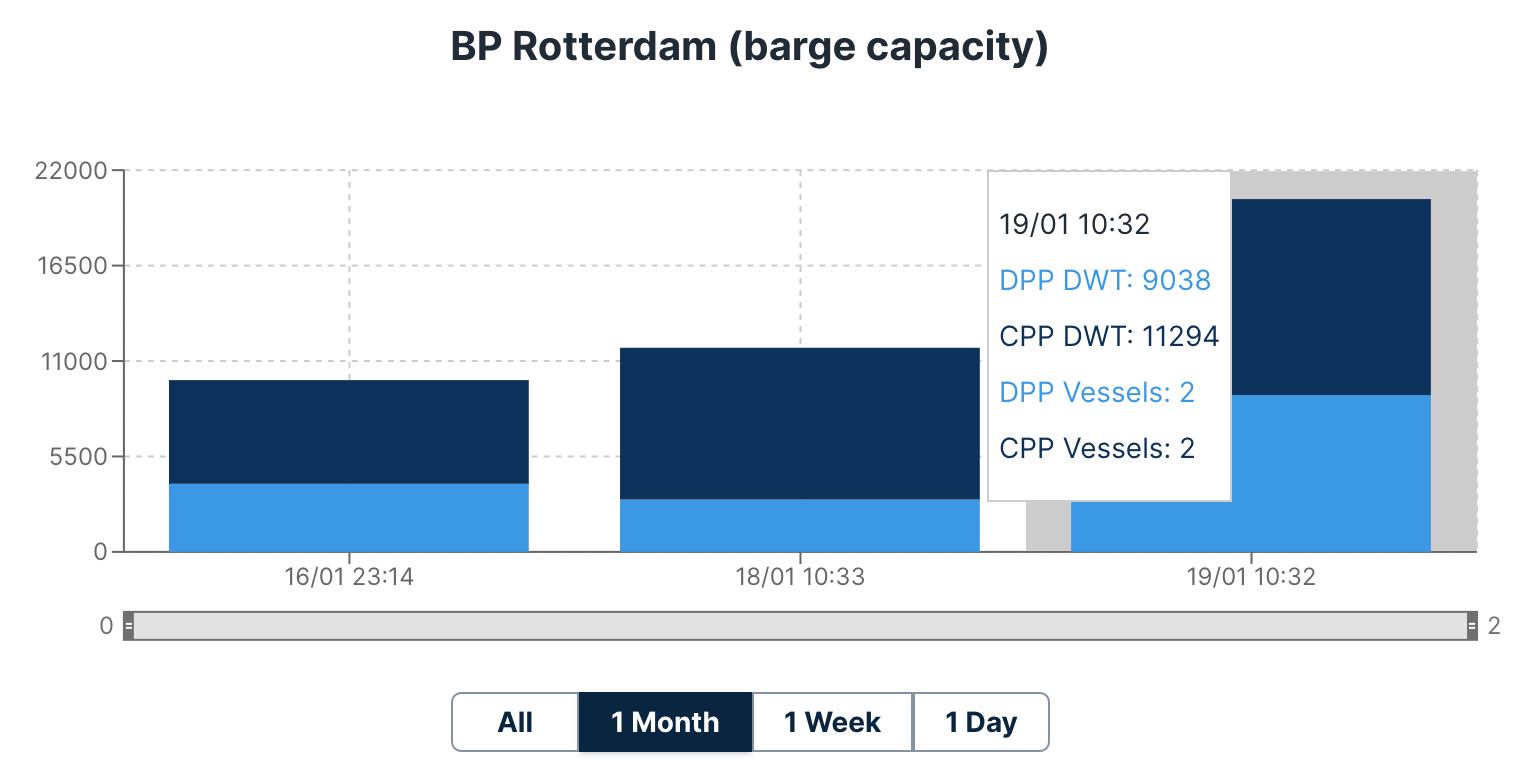
Our platform provides detailed insights into the operational activity of key refineries across Europe. By leveraging comprehensive graphs, users can monitor refinery utilization and analyze trends in barge activity, product categories, and capacity. This feature delivers actionable data to help you make informed decisions and identify opportunities in the market.

FARAG region refineries:
  • Includes six key refineries located in one of Europe's busiest trading areas.
  • These refineries play a pivotal role in exporting clean petroleum products (CPP) and (DPP) fuel oil.
Rhine river refineries:
  • Covers six essential refineries situated along the Rhine river, a critical artery for trade in inland Europe.
  • These refineries supply a variety of markets and serve as vital points for barge transportation across Europe.
Real-time monitoring & analytics

Real-time monitoring & analytics

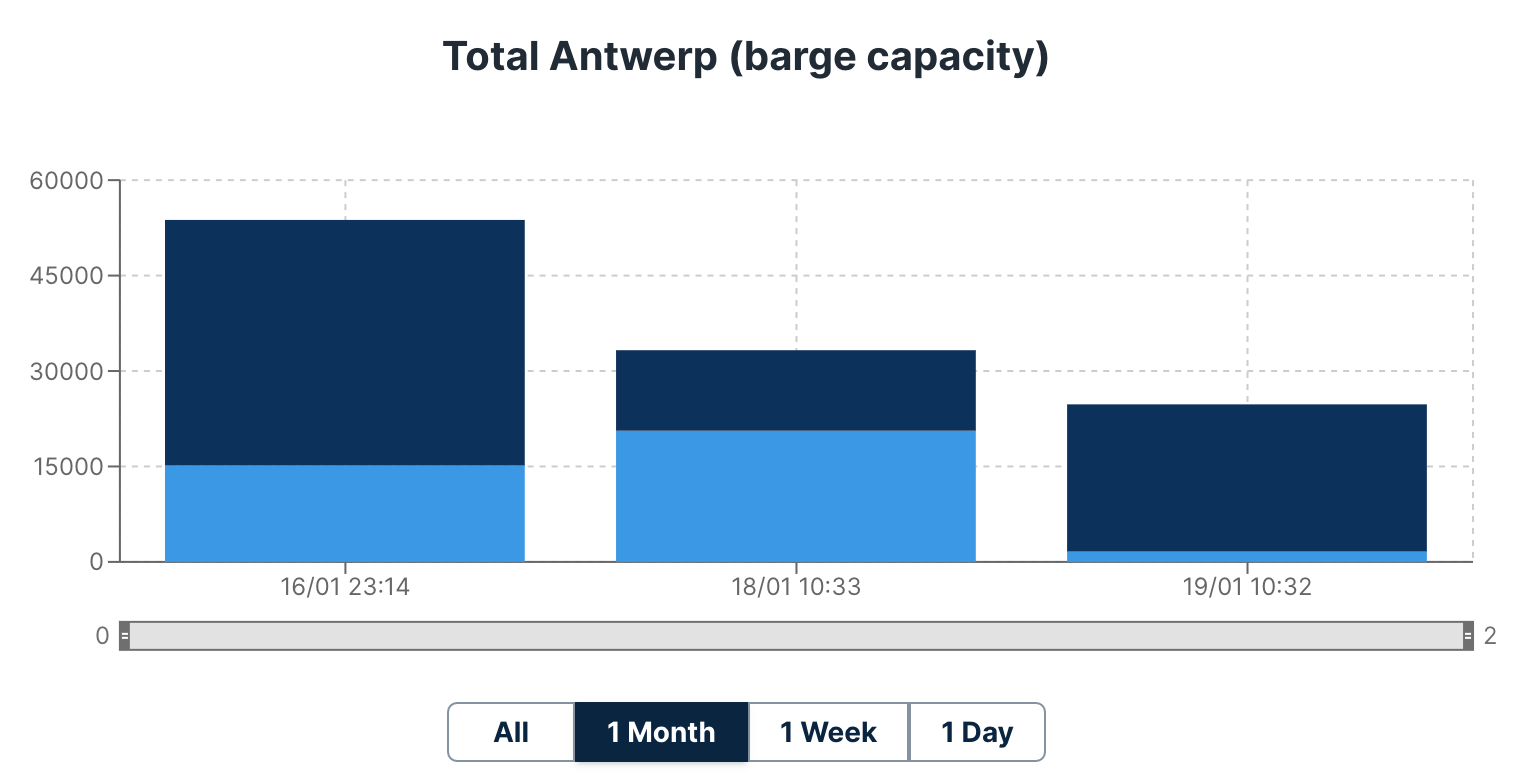
Comprehensive visualization of refinery operations and market dynamics

Key metrics tracked:
  • Number of barges: Track daily barge activity to understand how many barges are being handled at each refinery.
  • Product categories: Identify what types of products are being exported, from CPP to (DPP) fuel oil.
  • Barge capacity: Gain insights into the total barge capacity, helping you evaluate the refinery's throughput and efficiency.
  • Abnormalities & trends: Spot deviations from average export volumes, which can indicate changes in market demand, operational bottlenecks, or disruptions.
Market insights:
  • Export dynamics: Monitor the flow of refined products and understand which regions are experiencing surges in supply or demand.
  • Competitive analysis: Compare refinery activity levels to industry norms to identify which facilities are performing above or below market expectations.
Operational optimization & risk management

Operational optimization & risk management

Streamline operations and make informed decisions with real-time data

Efficiënt Middelen- en Capaciteitsbeheer:
  • Resource planning: Charterers and logistics managers can plan barge deployments based on refinery activity levels, ensuring assets are allocated efficiently.
  • Peak period management: Traders can avoid delays by analyzing when refineries are operating at or near capacity, choosing alternative suppliers or refining schedules.
  • Identify bottlenecks: Detect anomalies, such as sudden drops or spikes in refinery export activity, to anticipate supply chain disruptions or operational issues.
Strategic decision-making:
  • Trading strategies: Use real-time data on refinery exports to identify profitable trading opportunities or supply shortages.
  • Risk mitigation: Anticipate market disruptions caused by abnormalities in refinery operations, allowing for swift course corrections.
Enhanced collaboration & transparency

Enhanced collaboration & transparency

Strengthen relationships and improve negotiations with data-driven insights

  • Supplier insights: Gain clear visibility into refinery export trends, helping traders and brokers understand their suppliers' capabilities.
  • Improved negotiations: Leverage data to negotiate contracts or agreements based on current and historical refinery utilization metrics.