Rhine water levels significantly influence Rhine barge pricing, and has a direct impact on the FARAG region as well. During low water periods, barge capacity is redirected upstream along the Rhine, leading to reduced capacity in the FARAG area. This shift in supply dynamics can drive price fluctuations in the barge market.
To navigate these market dynamics effectively, Spotbarge provides a robust data service. By offering historical, real-time, and forecasted water level data, along with insights into seasonal trends, we empower stakeholders to make informed decisions. This includes anticipating capacity shortages, adjusting pricing strategies, and optimizing route planning to mitigate the impacts of varying water levels on their operations.
Request demo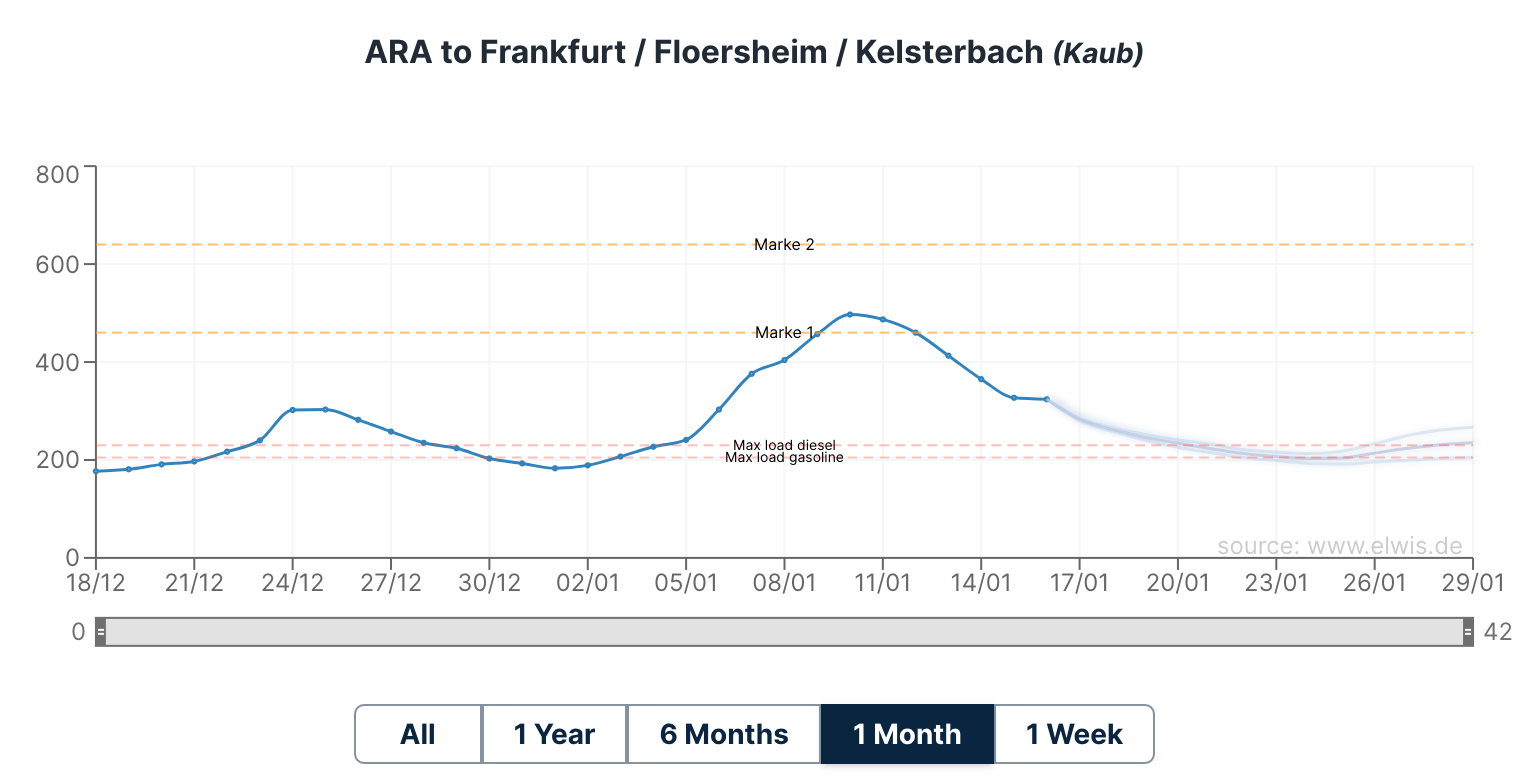
Spotbarge offers a comprehensive 14-day water level forecast for four strategic locations along the Rhine: Duisburg, Cologne, Kaub, and Maxau. These forecasts are not merely predictions; they are powerful tools that enable stakeholders to anticipate and adapt to changing market conditions, particularly during critical low water periods.
By leveraging Spotbarge's 14-day forecasts, you can:
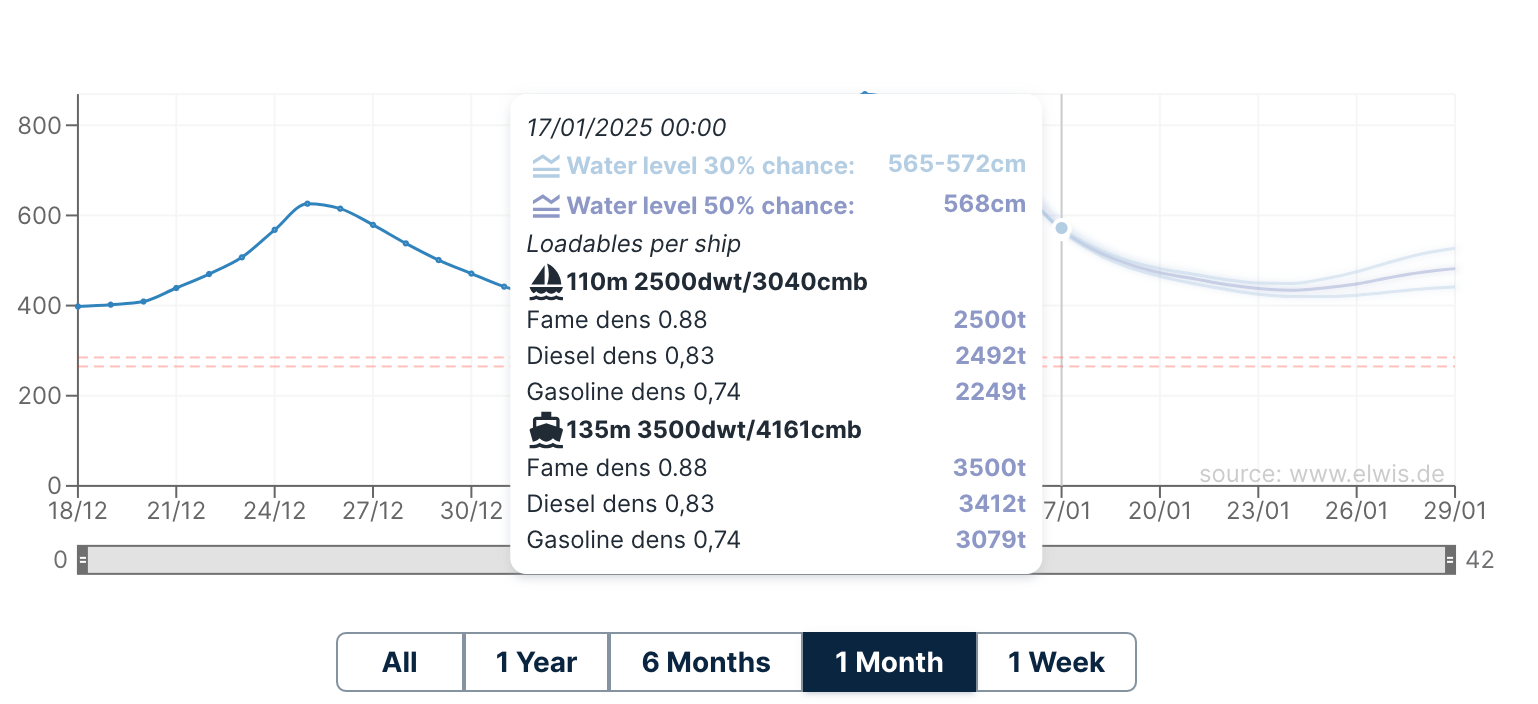
While water levels offer valuable insights, they do not directly indicate the loadable capacity of a barge. To address this, Spotbarge has integrated a user-friendly loadable algorithm into our platform. We have predefined two typical Rhine barge sizes in our system:
When you hover over the water level graph, you'll instantly see the loadable capacity for each barge type at the corresponding water level. To provide an even more accurate representation, we've incorporated different product types with their respective densities.
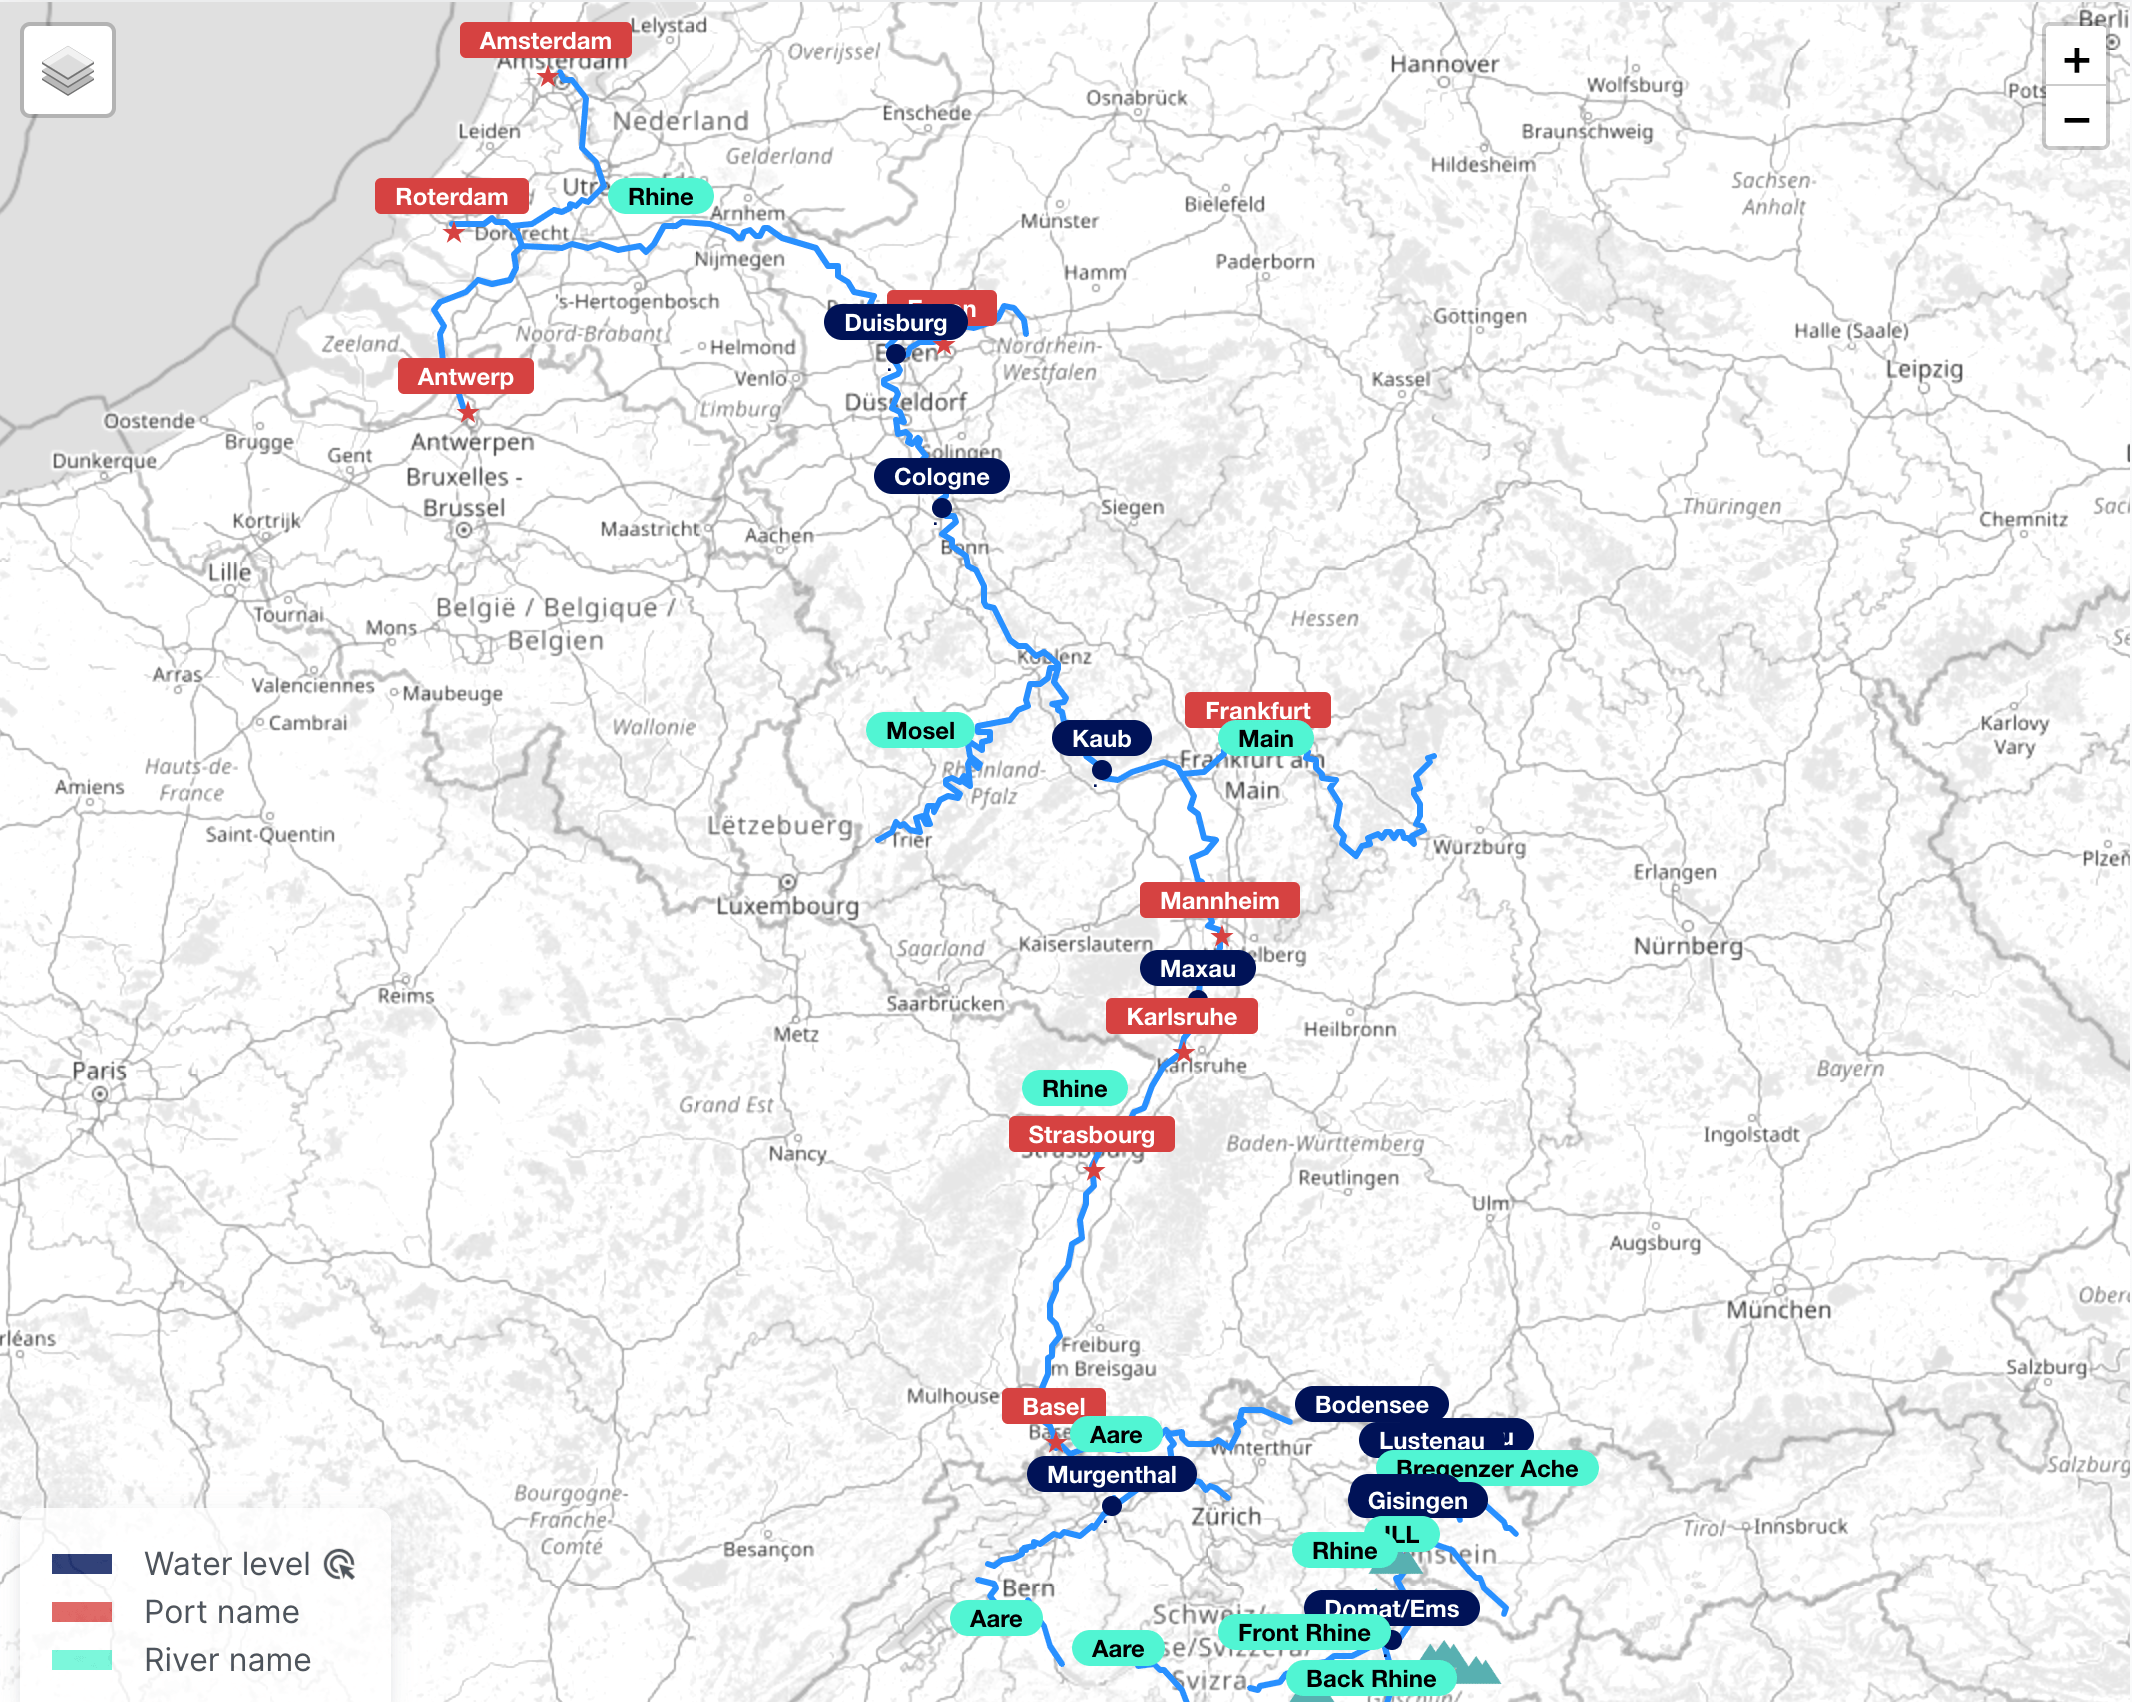
To enhance understanding of water level dynamics and their impact on barge loadings, Spotbarge has integrated an interactive map that displays water level measurement points along the Rhine. While locations like Kaub and Maxau may not be widely recognized, our interactive map helps you visualize these critical points and their influence on navigation and cargo capacity.
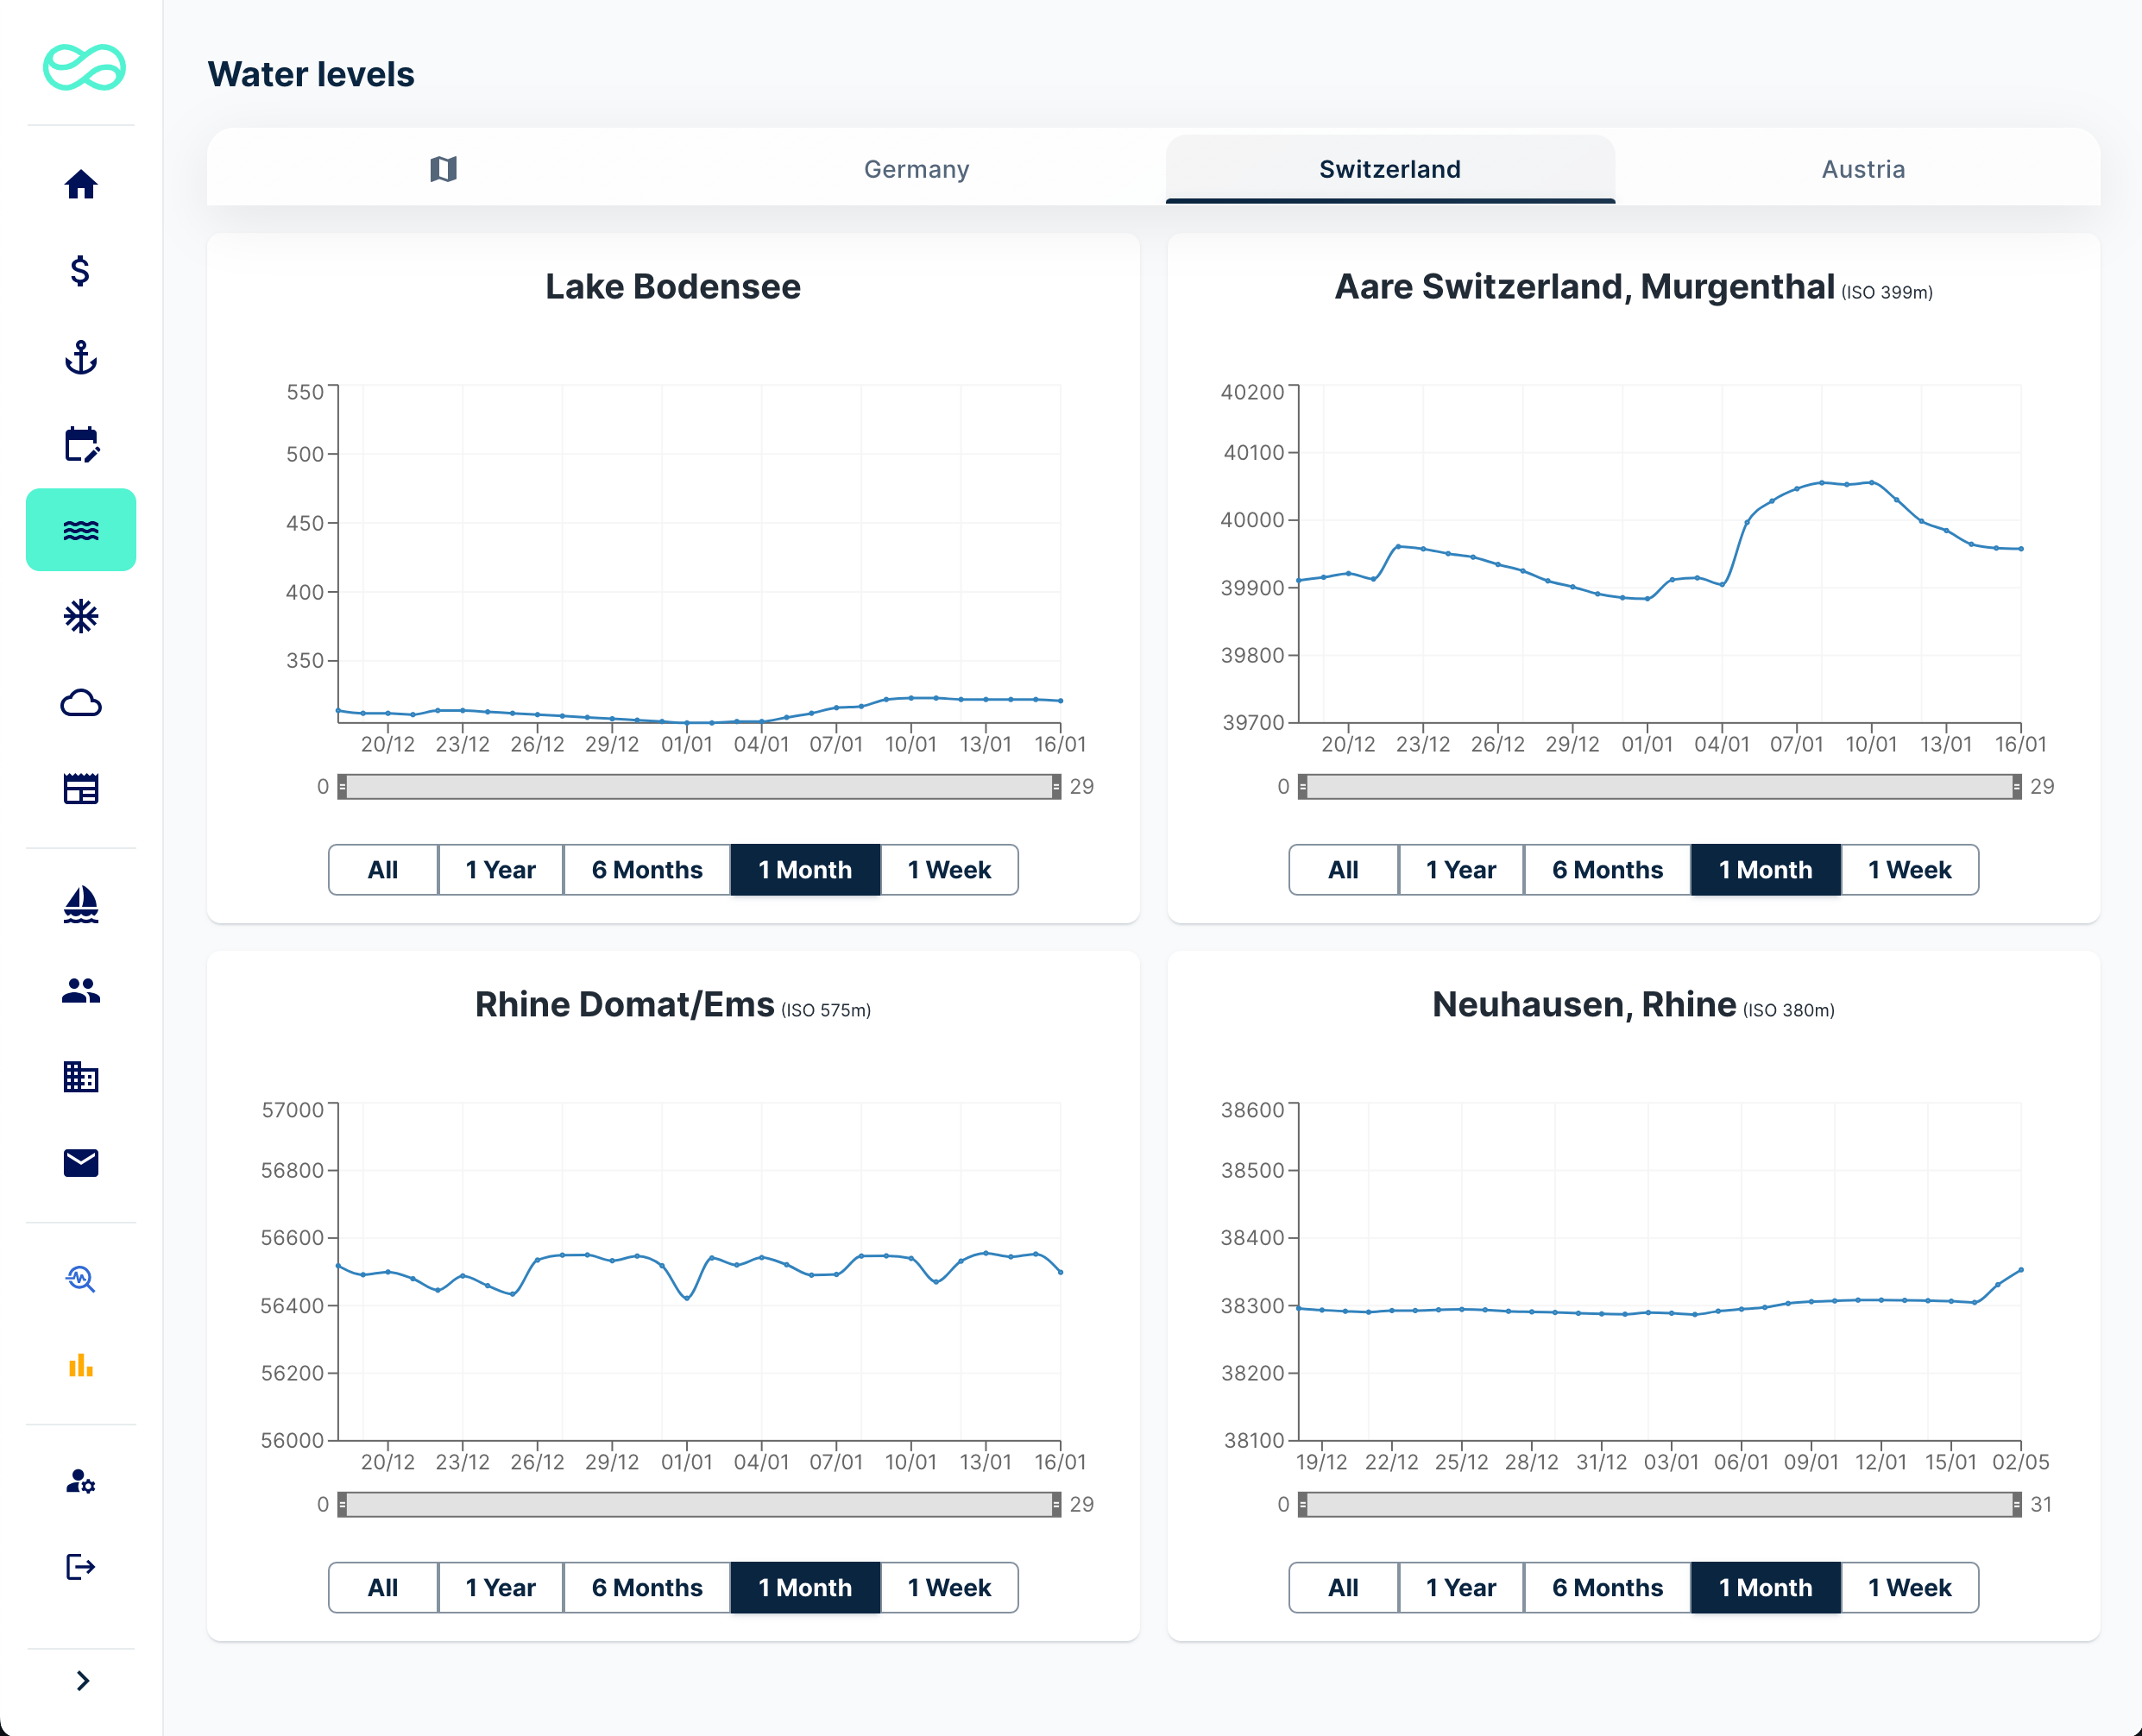
The Rhine finds its origin in the Alps, all the way from Switzerland and Austria coming from the mountains streaming in to lake Bodensee and from there continues again into the rhine river. Spotbarge indicated the main sub rivers which are all connected to lake Bodensee and the rhine river. By monitoring these one can anticipate earlier to rising or decline waterlevels and are therefore an important indicator.
Features
Users
Company
Resources
SpotBarge
© 2026 by Spotbarge B.V. All rights reserved.